A Decade at Google
One of the key challenges you face in an industrial research lab is how to choose your projects. You want your projects to be interesting research but also contribute to your company. As a junior researcher, you’re typically in the situation of choosing a project to join, while later in your career you are expected to come up with and lead your own projects. Regardless of your age, you have to make an educated decision.
It is common wisdom that you should not choose a project that a product team is likely to be embarking on in the short term (e.g., up to a year). By the time you’ll get any results, they will have done it already. They might not do it as well as or as elegantly as you can, but that won’t matter at that point. This advice can be challenging to follow in a fast moving company like Google and its cohorts, in which a third of the engineers have Ph.Ds. On the other hand, you also don’t want to be too far ahead of your company’s trajectory, so you need to choose projects
that you can imagine applying once you have substantial results.
The best way to find good projects is talking with people in different parts of your company or directly with customers, if that’s a possibility. Such conversations also ensure that you are creating the personal relationships that will prove invaluable when it comes time to apply your technology. Thinking ahead to the technology transfer is also critical. I use the term “technology transfer” because it is commonly used, but I actually highly dislike the term. The idea of “transfer” often implies a handoff from the developers of the technology to the ones who put it to practice, thereby excluding some of the most effective ways that technology can make an impact.
However, here I want to emphasize a different piece of advice that guided most of my work at Google.
Choose projects that play to your strengths
At Google, strengths are our abundance of data and our eager users willing to try out our new products. I will illustrate it with two examples.
Google Fusion Tables
It is a longstanding frustration in the database community that databases are too hard to use and most people who have data do not have the skills to set up and maintain a database application. Consequently, the majority of the world’s data is stored outside database systems. The vision underlying Google Fusion Tables (launched in June 2009) was to create a database system for the masses. Of course, we had to compromise on the features of the system, but the idea was to support several common data management workflows effectively and to enable a large number of data owners to enjoy the benefits of data management.
In doing so, we played to one of Google’s strengths, namely the presence of an international community of enthusiastic (but demanding) users who are willing to experiment with new products and help us push them forward rapidly. Within 24 hours of launching Fusion Tables, users from over 100 countries looked into the product, and the feedback started pouring in. We were able to validate our assumptions about which use cases are compelling and fine tune them.
The main workflow that Fusion Tables supported effectively is going from raw data (csv file, spreadsheet) to a meaningful visualization, which could also be embedded in the user’s own site. In doing so, we played to another one of Google’s strengths, our scalable mapping infrastructure. Visualizing data on maps turns out (not surprisingly at all) to apply to a broad range of domains. Fusion Tables was used in wide-ranging applications such as disaster relief (e.g., providing critical information to data in need after the 2011 Japan earthquake or before the NYC hurricanes), to being a favorite tool for journalists (to the extent that they administered tutorials on Fusion Tables at their own conferences), to visualizing the disparity between the location of patients with Multiple Sclerosis and the location of potential caregivers (thereby being able to channel appropriate resources to patients in need).

Figure 1: A visualization created using Google Fusion Tables after the 2011 Japan earthquake. The visualization shows which road segments were drivable after the earthquake and the tsunami. This and other visualizations got tens of millions of hits per day during times of need.
There was no technology transfer of Fusion Tables. We conceived, developed, launched and maintained the product completely within Google Research. Launching an external product from Google Research was tricky even in 2009 because contributions from research tend to enable or enhance existing products and not launch as standalones. However, Fusion Tables paid homage to Google’s mission to organize and make universally accessible the world’s information and there was no obvious place for it in the company. The downside of having the product completely within Research was that it didn’t have the resources of a normal product, which slowed down its growth. Witnessing how data can help people in need when it can be delivered to them in a timely fashion made for an exhilarating experience!
WebTables
The second example project is WebTables – studying the collection of HTML tables on the Web and serving it to Google users in response to queries. This project started purely from intellectual curiosity (that struck Mike Cafarella and myself at the same time), and we believed that these tables must somehow be useful. The strength we played to in this case was that we could run one MapReduce on the Google index and get the initial corpus of HTML tables in a single afternoon! We then could inspect the query stream to estimate how many queries might be well served by HTML tables. Of course, we then spent the next few years trying to recognize the good tables that consisted of less than 1% of the corpus.
Unlike Fusion Tables, where we published a paper only after the product was launched, we published papers about WebTables before making a search service available, since we thought we were making contributions of interest to the community. For a variety of reasons, it took almost four years from the inception of the project until we launched a search engine for tables, and two more years until we reached the holy grail: displaying rows from HTML tables in the Google search result page and within snippets. To reach this goal the team had to guarantee very high precision of matching queries to HTML tables. On the way, we discovered an unanticipated application of HTML tables as a research tool in Google Docs.
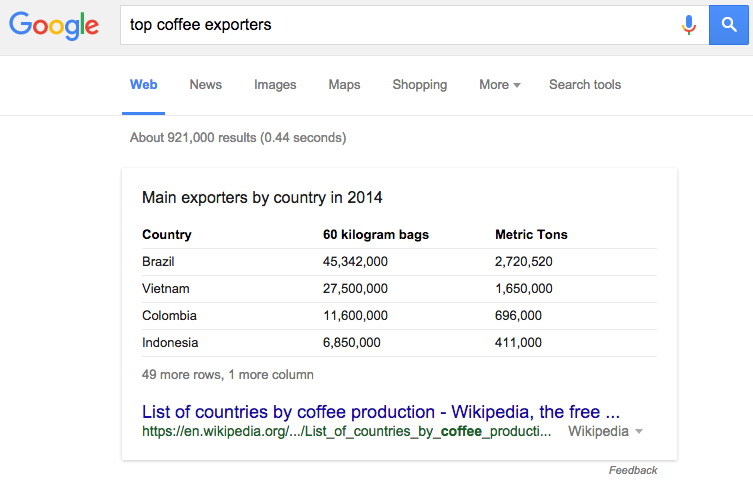
Figure 2: Rows from an HTML table in a result of a Google search
Here too, technology was not transferred in the typical sense of the word. The initial search engine was launched by a team within Google Research. About 10 minutes after we got approval to launch HTML tables on the main Google search result page, a Googler from Search Quality approached me and suggested that several of the researchers who were responsible for making WebTables possible join his team. The move turned out to be a great and timely opportunity for a few of them, and they have been driving the process within the Search team since then. HTML tables would never have seen the light of day otherwise.
WebTables had to face another common challenge, which is that a research innovation has to fit into a collection of ideas that form a product or search service, and must demonstrate distinct value in that context. In particular, while we were working on HTML tables, Google Search underwent one of its major shifts, in which it started answering queries from our Knowledge Graph (KG). The KG contains facts about famous entities in the world (people, companies, locations) and it was geared to answer “head queries,” i.e., queries that occur most frequently in the query stream and can be answered by structured data. The promise of HTML tables was that they could find data to answer the long and very heavy tail of queries which the KG wouldn’t likely answer. However, as the KG effort expanded, the head became broader and broader, and every time the KG added another domain, that put another dent in the coverage of WebTables. Still, WebTables answers many queries that are not answerable by the KG and pleases users worldwide millions of times a day.
Concluding Remarks
I’d like to conclude by sharing a few pieces of advice.
Never stop writing code
No matter how your role evolves, try to never stop coding (or if you cannot code, get involved in code reviews). You don’t necessarily need to be writing code that is on the critical path of your team (in fact, you probably shouldn’t) and you don’t have to be coding quarter after quarter, but you should try to do some coding on a regular basis. I was inspired to code by two of my good friends, Stanford professors Pat Hanrahan and Dan Boneh, both undisputed leaders in their fields, who are constantly involved in some coding activity. At Google, I found opportunities to code in the very initial stages of building a product that later morphed into Fusion Tables, while exploring a new idea with WebTables, and when building the entire first version of Biperpedia, a system for mining the long tail of schema attributes. My coding activities were always productive. They either launched a new project or a major change in direction of a project. They also enabled me to have discussions with my team members at a completely different level of detail (to everyone’s enjoyment). In a world where coding practices and tools are changing so rapidly, coding often helped me keep on top of things. Most of all, I enjoyed them and they reminded me of the fun that attracted me to our field many years ago!
Never stop looking at data
Over the years, I realized there was a trait that correlated well with success when addressing complex and data-heavy tasks: the ability to obsessively look at great amounts of data until you gain insights. As Ph.D’s in Computer Science, we’re not necessarily trained to spend hours looking at data. We’re much better at obsessively tweaking the algorithm to get it to do the right thing, but we often get bored after looking at a handful of example data items (us database management folks are probably even worse than average!). At Google we have the gift of data, but it surprised me to see how often researchers and engineers would shy away from it. I have found time and time again that engineers and researchers that obsess over their data end up discovering the critical observations that enable them to develop effective algorithms. Additionally, when you present an idea, you sound much more compelling when you have examples rolling off your tongue.
Academia vs. Industry
As a former academic, I’m often asked about the difference between academia and industry. There are many answers to this, including the fact that in industry you need to solve the entire problem rather than cherry pick the nugget you wish to solve elegantly. The main difference, however, which can be very subtle and perhaps only obvious in hindsight is the following. (I originally heard this observation from Prabhakar Raghavan before joining Google, but it took me a decade to internalize it). In academia, as you pursue your passion for science and technology, the evaluation of faculty creates pressure to further your career as an individual, whether it is through publications, graduating and promoting your students or being an excellent educator. You are by necessity the champion of your own ideas, which I think is ultimately a critical ingredient to scientific progress. In contrast, to be successful in industry, whether in engineering or in research, you often need to put your individual goals and ideas aside. You need to find the most effective way to get to a great product or service (or part thereof) even if it means finding the right mix of ideas. You will be rewarded for contributing key ideas to a product, but you will be rewarded even more for getting the job done, collaborating effectively across teams, and pleasing customers. This advice may be even more useful for academics founding startups. Once you founded your company based on the great research you conducted at the university, the company takes a life of its own and the most important goal is to create a product that users want.
Work life balance
Much has been written about finding work life balance. My 2 cents are simple. You do not reach balance by reducing work. You reach balance by finding a passion that draws you out of work. Of course, family comes first on this ladder, but we often need some other passion. In my case, I had the most wonderful experience writing a book about coffee. I did not plan it as a worklife balance treatment, I just realized it in hindsight. With the exception of spending time with my kids, I found that the evenings spent researching and writing about coffee (let alone the exotic trips I had to take as part of this learning) gave me hours of respite without thinking about work.
Acknowledgments:
No matter where you are or what you do, the most important thing is working with great people. I cannot possibly thank everyone I worked with at Google, but I’ll mention a few. Jayant Madhavan, Hector Gonzalez and Anno Langen were the force behind the early days of Google Fusion Tables. Mike Cafarella started the WebTables project and while he was an intern, led an army of interns to build the first version. Cong Yu and Boulos Harb turned the initial prototype of WebTables into an externally facing service and drove the creation and maintenance of the table corpus. Jayant Madhavan, Hongrae Lee, Sree Balakrishnan, Cong Yu, Boulos Harb and Afshin Rostamizadeh worked together to get HTML tables on the Google search result pages. Jayant Madhavan is my canonical example of a person who can obsess over data and glean incredible value from it. I’ve also been lucky to work with Luna Dong, Fei Wu, Chung Wu, David Ko, Alkis Polyzotis, Chris Olston, Natasha Noy, Rod McChesney, Sudip Roy, Steven Whang and Xiao Yu, three awesome sabbatical visitors Christian Jensen, Zack Ives and Sunita Sarawagi and over 40(!) summer interns.
Blogger Profile:
Alon Halevy heads the Structured Data Management Research group at Google. Prior to that, he was a professor of Computer Science at the University of Washington in Seattle, where he founded the Database Group. In 1999, Dr. Halevy co-founded Nimble Technology, one of the first companies in the Enterprise Information Integration space, and in 2004, Dr. Halevy founded Transformic, a company that created search engines for the deep web, and was acquired by Google. Dr. Halevy is a Fellow of the Association for Computing Machinery, received the Presidential Early Career Award for Scientists and Engineers (PECASE) in 2000, and was a Sloan Fellow (1999-2000). Halevy is the author of the book “The Infinite Emotions of Coffee”, published in 2011, and serves on the board of the Alliance of Coffee Excellence. He is also a co-author of the book “Principles of Data Integration”, published in 2012. Dr. Halevy received his Ph.D in Computer Science from Stanford University in 1993 and his Bachelors from the Hebrew University in Jerusalem.
Copyright @ 2015, Alon Halevy, All rights reserved.
12 Comments
Comments are closed
This is an excellent and well thought out piece Alon! Congratulations on such
a successful career at Google, and for making a difference in this world!
Thank you very much, Vinay!
Thank you so much for writing this article. I worked in a startup which tried to do something similar to WebTables – and we were “over” when Google launched it. Nevertheless, I was so delighted (and part-dismayed) to see it launch and working on such a huge scale.
Thanks again. Brilliant article. And yes, we did shut down after another 3 years of struggle.
Thank you Kiran! I’m sorry to hear about what happened to your startup — you were certainly working on an important problem. If it’s any consolation, I think it would be very difficult to make a business purely based on tables on the Web. I’ve seen several companies try this and fail. Tables are useful as one feature of many of a search engine.
Congratulations Alion on such
a successful career at Google! Nice article!
Thank you Gaurav!
I have been very curious for well over a decade now — since 2002 — about what it means to do research at Google. That year I encountered two different schools of thought. First, I read this article by Cringely, in which he laments losing our appetite for basic research and compares it to eating our seed corn:
http://www.pbs.org/cringely/pulpit/2002/pulpit_20021010_000748.html
Second, that same year I had a conversation with Peter Norvig in which he told me that Google “does not do Research and Development; it does Engineering and Development”. The critical difference being the notion that any research idea that is developed has a required 5 month lifecycle from initial concept to prototype that isn’t just standalone, but that is integrated with a product, perhaps in some A/B or other testable form in which it is receiving customer feedback and is therefore capable of being iterated on.
So while it shocked me slightly that Google had no long term vision for 10-15 year basic research, as outlined by Cringely, it shocked me even more that Google also had no medium term vision, the 3-5 year cycle that is common in industrial research labs for applied research. It was all on the 5 month cycle.
Now, in your blog post you alluded not once, not twice, but three times to the notion of technology transfer (or whatever term you prefer), and how it was approached differently at Google. I believe that is the E&D rather than R&D school of thought that Norvig mentioned. However, reading what you say about WebTables, the requirement that the technology “transfers” within a 5 month cycle seems to have changed:
“Unlike Fusion Tables, where we published a paper only after the product was launched, we published papers about WebTables before making a search service available, since we thought we were making contributions of interest to the community. For a variety of reasons, it took almost four years from the inception of the project until we launched a search engine for tables, and two more years until we reached the holy grail: displaying rows from HTML tables in the Google search result page and within snippets.”
That sounds an awful lot like classic 3-5 year industrial applied research. Unlike the 5 month E&D cycle (in which Norvig told me that any research has to be conducted within the framework of an ability to immediately deploy that research into a product, or even to do the research in the product itself, in order to avoid the typical “tech transfer” mindset) this WebTables approach was done outside of the context of an existing product, for the sake of advancing the state of knowledge, to figure out whether or not something was even possible. And rather than that taking 5 months, it took 4 years — the classic amount of time for applied research.
So does this mean that Google is changing / has changed? Or were your experiences atypical of the average research scientist?
The reason I’m curious is that Google’s success has allowed it to set a precedent, a model that the field has a whole has a tendency to want to emulate. And that precedent leads me back to the Cringley warnings from 2002. I wonder whether the ability to put on a few more pounds of success comes from having eaten one’s seed corn rather than from having increased the harvest yield. I.e. I wonder whether the E&D approach is long-term sustainable. Therefore, if the entire industry emulates the Google approach because of this decade+ of success, the whole industry might run out of seed corn.
So, seeing that you yourself have already experienced at least one shift away from the 5 month cycle, and back to a more traditional 3-5 year cycle makes me think that perhaps there has been an increase in the willingness to plant for the long term again.
Apologies for the length of this comment. But, thoughts?
I think Peter Norvig’s statement might be a little biased. Research ideas in different areas have different typical life cycles — you can make a graph/AI algorithm working in five months, but you can hardly do so for a system/architecture thing. It shocks me as well that Peter said like that as an author of the front-page article “Google’s Hybrid Approach to Research” which gives examples of systems infrastructure projects such as MapReduce, Google File System and BigTable. Also, I don’t think it is a “shift” in Google as you interpret — there are just various patterns of research, various characters of people, and various forms of projects in Google, I guess.
Very well said!
Well, Jinglei, it wasn’t just Peter who said this in 2002. Another one of my fellow PhD students back in 2002 talked to a different high level Googler right around that same time and was told the exact same story: Google’s pattern for research was this 5 month cycle. So if there was bias, the bias was more than just Peter’s, not just limited to one person.
Alon, I had a look just now at the 2012 article that you mentioned. What it describes as the primary method of doing research (writing near-production code from near-day one, getting immediate user feedback, and factorizing longer-term projects into a sequence of achievable shorter term projects, each with their own metrics and rewards) is pretty much exactly what Peter described to me in 2002. The whole idea of that 5 month cycle matches perfectly with the factorized shorter term project.
And I even like that Spector, Norvig, and Petrov admit that this model might not be capable of making larger leaps. The analogy that I used, myself, back in 2002 was to an airplane. You can’t break down the research problem of creating a flying machine into smaller units.. five months spent on fuselage, then five months on wing #1, then five months on wing #2, etc. Either the the thing flies or it doesn’t. Having one wing means it doesn’t fly. You have to spend fifteen months doing both wings at the same time as you figure out how they best attach to the fuselage, instead of multiple five month periods doing one wing at a time.
And so that’s where I’m still curious about what you describe with WebTables. What it sounds like from your post is that when you did WebTables over that period of four years, it was a single four year research project. Rather than 9 or 10 five month research projects. And it sounds like the project did not get it in front of users from near day-one.. it was only at the end of the 4th year that you finally got it in front of end users, at which point it was iterated (in a more Google-standard manner) for another two years with end user feedback after that. That is, the research trajectory that it followed did not comport to either the 2002 or the 2012 Google “standard” approaches?
Because if so, it is very exciting to me to see that diversity within Google. In your comment, you do say that research there is done in many ways, but this is the first time I am actually hearing a great, successful story about a cool project having been done in a different manner. Maybe it has been that way for a while, internally. But again, all we get from the outside are articles like the 2012 one, or my conversations from 2002, which tell a different story. So, thank you for sharing.
There have been many changes at Google since 2002 and research is done in many ways at the company. I highly recommend an article by Spector, Norvig and Petrov, titled “Google’s Hybrid Approach to Research”. It’s the most accurate description of how we think about research at Google.
I have a creative idea and I want to be applied with Google Inc.